Python/Time Series with Python
TimeSeries with Python _ Pandas 3 _Shift, Rolling, Expanding
MINSU KANG
2019. 12. 24. 22:18
이번 포스팅에서는 Pandas의 메소드중 데이터 분석에서(특히나 금융 데이터 분석)에서 유용하게 사용되는 Shift, Rolling, Expanding의 사례를 적어본다
#%% Shift of Pandas

df = pd.read_csv(path, index_col = "Date", parse_dates=True)

df.head()

df.tail()

df.shift(1).head() #뒤의 날짜의 데이티를 앞으로 한칸 땡긴다 (forward)

df.shift(-1).head() # 앞의 날짜의 데이터를 뒤로 한칸 땡긴다 (backwards)

df.shift(periods=1, freq='M').head() #한달 기준으로 앞으로 땡긴다
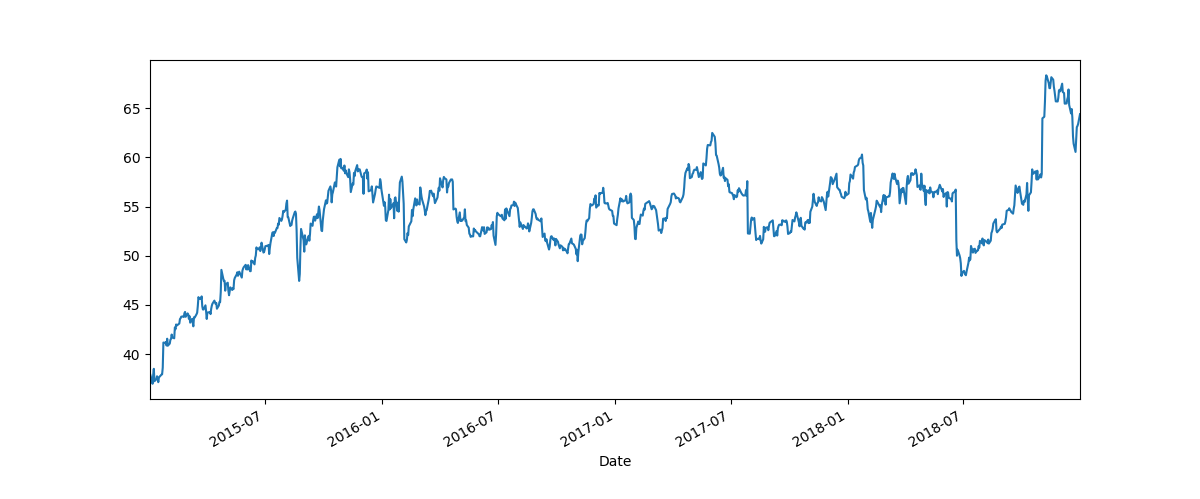
#%% Rolling and Expanding

#Rolling

df = pd.read_csv(path, index_col = "Date", parse_dates=True)

df['Close'].plot(figsize=(12,5)).autoscale(axis='x', tight=True)
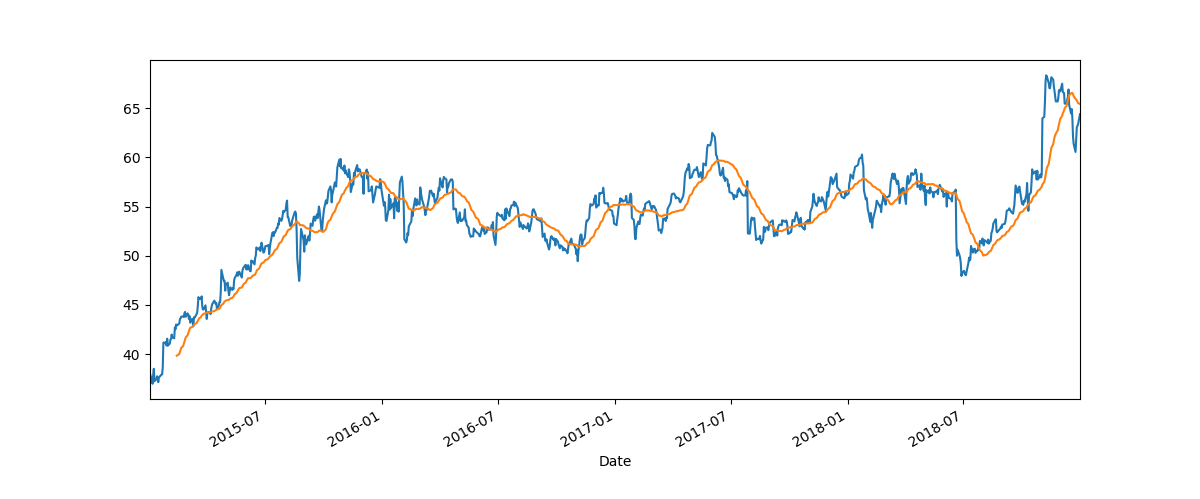
df.rolling(window=7).mean() #7일 기준 이동평균을 구하는 방법

df['Close'].plot(figsize=(12,5)).autoscale(axis='x', tight=True)
df.rolling(window=30).mean()['Close'].plot()

df['Close: 3D Day Mean'] = df['Close'].rolling(window=30).mean() #새로운 컬럼을 만들어서 plot으로 한꺼번에 같이 그리기

df[['Close', 'Close: 3D Day Mean']].plot(figsize=(12,5)).autoscale(axis='x', tight=True)
#Expanding
# Expanding의 경우 window를 누적하면서 수치화 하는 방법
# Rolling의 경우 데이터가 window기준으로 움직이지만, Expanding의 경우 min_periods를 기준으로 누적하면서 수치화함
df['Close'].expanding(min_periods=30).mean().plot(figsize=(12,5))